Ancestry Composition
Your DNA tells the story of who you are and how you're connected to populations around the world. Trace your heritage through the centuries and uncover clues about where your ancestors lived and when.
.jpg)
-
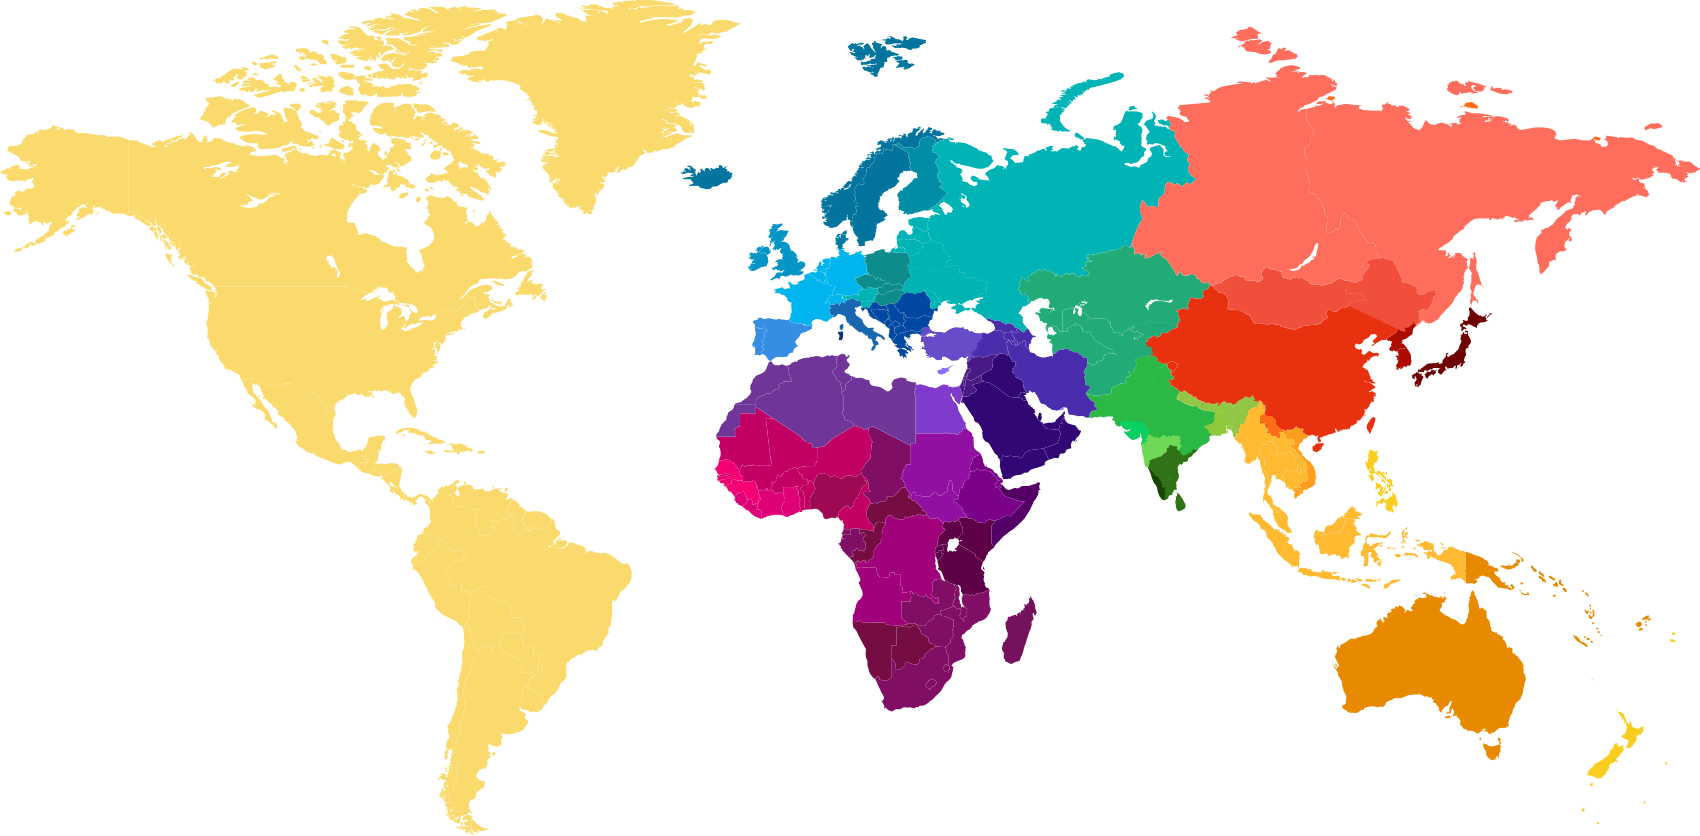
This button changes the visibly highlighted geographical location on the map based on the name of the button.
-
-
Southern Europe, including the Iberian, Italian, and Balkan peninsulas as well as the island of Malta, is a region defined in great part by the Mediterranean Sea. The Mediterranean has provided transportation routes, keeping these regions connected culturally and genetically.
-

“Spanish and Portuguese” ancestry was influenced by several Mediterranean civilizations. Today, this ancestry is common in people of Latin American descent.
We predict you had ancestors in Canary Islands, Spain; and 9 more regions within the last 200 years.
Canary Islands, Spain+9 regions -
Southern Europe, including the Iberian, Italian, and Balkan peninsulas as well as the island of Malta, is a region defined in great part by the Mediterranean Sea. The Mediterranean has provided transportation routes, keeping these regions connected culturally and genetically. Broadly Southern European DNA matches several specific populations and is difficult to assign to just one.
-
Northwestern Europeans are represented by people from as far west as Ireland, as far north as Norway, as far east as Finland, and as far south as France. These countries rim the North and Baltic Seas, and have been connected throughout much of history by those waters.
-
Northwestern Europeans are represented by people from as far west as Ireland, as far north as Norway, as far east as Finland, and as far south as France. These countries rim the North and Baltic Seas, and have been connected throughout much of history by those waters. Broadly Northwestern European DNA matches several specific populations and cannot be assigned to just one. This shared heritage may be the result of extensive migration, possibly including the Germanic invasions of the early Middle Ages.
-
Much of Europe was buried under miles of ice ten thousand years ago. As the glaciers receded over millennia, Neolithic farmers from western Asia joined Paleolithic hunter-gatherers to settle Europe. Some European DNA is difficult to assign confidently to one population and receives a “Broadly” designation.
-
-
This button changes the visibly highlighted geographical location on the map based on the name of the button.
-
-
.jpg)
North, Central, and South America were first populated around 15,000 years ago following the arrival of Native Americans from northeast Asia.
-
The peoples of East Asia and the Americas have a shared genetic history. Their common ancestors left western Asia over 50,000 years ago, migrating east across the continent. The ancestors of Native Americans began to cross into the Americas 12,000 to 15,000 years ago. Broadly East Asian & Native American DNA is a relic of this ancient population split, and reflects shared roots in central and northern Asia.
-
-
This button changes the visibly highlighted geographical location on the map based on the name of the button.
-
-
For over a millennium before European colonization and the Atlantic slave trade, West Africans were united under a series of powerful empires, resulting in broad similarities in music, clothing, art, and cuisine. A gradient of genetic similarity extending from Senegal to Nigeria reflects a richly complex population history in a region home to over 350 million people who form hundreds of distinct ethnic groups.
-
.jpg)
The people of the coastal countries above the Gulf of Guinea are genetically similar and are distinct from neighboring regions.
-
.jpg)
Nigeria’s population is the largest in Africa and one of the most diverse, with over 250 ethnic groups, including the Hausa, Fulani, Yoruba, and Igbo people.
-
.jpg)
The people of Senegal, The Gambia, Guinea, and Guinea-Bissau share many traditions related to the history of powerful empires in the region. In The Gambia, the Mandinka people are the largest group, with historical roots along the Niger River basin, while the Wolof people form the majority in neighboring Senegal. In Guinea and Guinea-Bissau the Fulani people predominate, and may have subtle genetic links to North Africa or western Asia. In the 18th century, around 400,000 people from this region were enslaved and transported to the Americas; nearly 50,000 disembarked in the United States alone.
-
For over a millennium before European colonization and the Atlantic slave trade, West Africans were united under a series of powerful empires, resulting in broad similarities in music, clothing, art, and cuisine. A gradient of genetic similarity extending from Senegal to Nigeria reflects a richly complex population history in a region home to over 350 million people who form hundreds of distinct ethnic groups. Broadly West African DNA may match several populations, making it difficult to assign to just one.
-
Starting around 3,000 years ago, Bantu speakers carried metallurgy and agriculture from the highlands of Nigeria and Cameroon in two major streams – one southward and one eastward – resulting in ancestry that transcends geopolitical borders. “Bantu” is a term widely used to describe the largest of Africa’s ethnolinguistic families.
-
.jpg)
Beginning around 3,000 years ago, the genetic tapestry of the Congo basin was transformed by the influx of Bantu-speaking peoples from the north.
-
.jpg)
Within the last 3,000 years, metallurgy and agriculture arrived in Southern East Africa with the migration of Bantu-speaking peoples from Nigeria and Cameroon.
-
Starting around 3,000 years ago, Bantu speakers carried metallurgy and agriculture from the highlands of Nigeria and Cameroon in two major streams – one southward and one eastward – resulting in ancestry that transcends geopolitical borders. “Bantu” is a term widely used to describe the largest of Africa’s ethnolinguistic families. Likely as a result of these rapid and widespread expansions across Central and Eastern Africa, it is difficult to assign a specific location within Sub-Saharan Africa to some chromosomal segments with a high degree of confidence.
-
The genetic diversity of Sub-Saharan Africa reflects both the deep history of humans in the region and the recent migrations that have carried people from western Africa to both southern and eastern Africa. As a result of this ancient and complex population history, it is difficult to assign some DNA to a specific population within Sub-Saharan Africa.
-
-
This button changes the visibly highlighted geographical location on the map based on the name of the button.
-
-
.jpg)
The genetic heritage of most North African people today reflects an ancient mixture of indigenous North African, southern European, western Asian, and Sub-Saharan ancestry.
-
The peoples of western Asia and North Africa have deep linguistic and genetic connections with one another, dating back to some of the earliest migrations out of Africa. The spread of Islam in the past 1,400 years has also dramatically shaped the region's more recent genetic landscape. As a result, it may be difficult to confidently assign some DNA to just one population.
-
-
-
We detected traces of the following populations in your DNA. Read more about trace ancestry in the FAQ.
-
Central & South Asia are represented here by diverse populations from India and Sri Lanka in the south to Kazakhstan and Uzbekistan in the north. Some Central & South Asian DNA is difficult to assign confidently to one population and receives a “Broadly” designation.
-
-
-
There is a wide range of human diversity in the world, and sometimes our algorithm is unable to match a region of your DNA to a specific population with confidence. Individuals whose ancestors came from multiple continents and who mixed many generations ago typically see more “unassigned” ancestry in their Ancestry Composition. Individuals whose ancestors came from just one continent (or individuals whose ancestors intermixed more recently) typically see less “unassigned” ancestry.
-
Ricardo 100%
-
Recent Ancestry in the Americas
We found evidence of your ancestry in the following locations. People from these regions can often trace their ancestry to different, historically separate populations.
-
.jpg)
In the five centuries since Spanish and Portuguese conquistadors made contact with the Indigenous populations of South America, millions of Africans as well as waves of European and Asian immigrants have transformed the continent’s genetic landscape.
We predict you had ancestors who may have lived in Boyaca, Colombia; Zulia, Venezuela; and 18 more regions within the last 200 years.
Boyaca, ColombiaZulia, Venezuela+18 regions -
.jpg)
Although humans have lived in the Caribbean for over 7,000 years, genetic evidence suggests most people from the region now have ancestral roots tracing back to southern Europe and western Africa.
We predict you had ancestors who may have lived in Havana, Cuba; and 9 more regions within the last 200 years.
Havana, Cuba+9 regions
Your Ancestry Timeline
How many generations ago was your most recent ancestor for each population?
How to interpret this result
- This module uses your Ancestry Composition results to estimate the generation range where you are likely to have had a single relative who descended from a single population.
- These results may be helpful for learning about your genealogy, in figuring out from which ancestors a particular ancestry may have been inherited, or for piecing together the history of their likely migrations.
- For technical details on how this feature works, read our white paper.
Your Ancestry Composition Chromosome Painting
These are your chromosomes; we've painted them with your Ancestry Composition results. The first 22 are called autosomes and come in pairs of two, each represented by one of the colored horizontal lines in the graphic below. Chromosomes have different lengths, and are named 1 through 22, when sorted by size (scientists are not very creative). Lastly, we also look at ancestry on your X chromosome: two copies like the autosomes if you are female, and only one copy if you're male (that you got from mom).
Your Ancestry Composition Results
At the heart of your Ancestry Composition report is your ancestral breakdown: a list of your population percentages arranged in a hierarchy from the continental level to the regional level. You may notice another layer of insights about the likely origins of more recent ancestors; these specific recent ancestor locations are listed beneath each regional population percentage.
How we calculate your ancestral breakdown
To determine your ancestral breakdown, we use an algorithm that individually looks at short pieces of DNA across your genome. We compare each piece to DNA from reference populations from around the world (i.e. thousands of individuals with known ancestry). When a piece of your DNA resembles the DNA from a specific reference population with a high degree of confidence, it is assigned to that population. Sometimes a piece of DNA resembles reference DNA from several populations, in which case it is assigned to a "broad" ancestry (e.g. Northwestern European). If a piece of DNA does not closely resemble reference DNA from any populations, then that piece of DNA shows up in your results as Unassigned ancestry. These assignments are tallied across your genome to determine your final results. By default, your results are calculated at a 50% confidence level; you can see how your results change with different confidence levels in the Chromosome Painting section.
Read our Ancestry Composition Guide or our white paper for more details about how we assign your DNA to different ancestries.
Current Ancestry Populations
How we determine your recent ancestor locations
Recent ancestor locations (found in your Ancestry Detail reports) are intended to complement your ancestral breakdown and provide a more recent and granular view of your ancestry. To determine these results, we look for identical pieces of DNA that you have in common with individuals of known ancestry from around the world. Reference populations for recent ancestor locations are comprised of over 400,000 customers, and this number will continue to grow as our customer database expands. Each recent ancestor location has its own unique demographic history, so we've calibrated our algorithm to better reflect these differences. For a given recent ancestor location, we indicate our confidence in the result, reported as "possible match," "likely match," or "highly likely match." If we are not able to detect recent ancestry from a location with confidence, we report this to you as "not detected."
The maps on your Ancestry Detail Reports are a visual representation of your recent ancestor locations down to the state and county level. A map is generated by aggregating the ancestral origins of individuals who share a minimum amount of DNA with you. Your results are a living analysis and will improve over time as more people with known ancestry join our gene pool.
Have more questions? Check out the Frequently Asked Questions section.
All 216 Tested Populations
In addition to the population percentages associated with your ancestry composition, your results might include recent ancestor locations. Explore the table below to learn more about where we've found evidence of your ancestry around the world.
This table shows the number of reference individuals used to define each ancestry population. The reference datasets are made up of individuals from publicly available datasets including the Human Genome Diversity Project , HapMap , and the 1000 Genomes project , as well as individuals from private 23andMe data collections and a large number of 23andMe customers who have consented to participate in research. In total, there are 11,742 research-consented customers and 2,651 non-customers in these population reference datasets.
-
Percent Southern European ancestry: 62.6.
-
Percent Spanish & Portuguese ancestry: 57.2.Match Confidence level for Spain: Possible MatchMatch Confidence level for Portugal: Not Detected
-
Percent Greek & Balkan ancestry: 0.0.Match Confidence level for Albania: Not DetectedMatch Confidence level for Bosnia and Herzegovina: Not DetectedMatch Confidence level for Bulgaria: Not DetectedMatch Confidence level for Croatia: Not DetectedMatch Confidence level for Greece: Not DetectedMatch Confidence level for Moldova: Not DetectedMatch Confidence level for Montenegro: Not DetectedMatch Confidence level for North Macedonia: Not DetectedMatch Confidence level for Romania: Not DetectedMatch Confidence level for Serbia: Not Detected
-
Percent Italian ancestry: 0.0.Match Confidence level for Italy: Not DetectedMatch Confidence level for Malta: Not Detected
-
Percent Sardinian ancestry: 0.0.
-
Percent Broadly Southern European ancestry: 5.4.
-
Percent Northwestern European ancestry: 0.5.
-
Percent British & Irish ancestry: 0.0.Match Confidence level for Guernsey: Not DetectedMatch Confidence level for Ireland: Not DetectedMatch Confidence level for United Kingdom: Not Detected
-
Percent Finnish ancestry: 0.0.Match Confidence level for Finland: Not Detected
-
Percent French & German ancestry: 0.0.Match Confidence level for Austria: Not DetectedMatch Confidence level for Belgium: Not DetectedMatch Confidence level for France: Not DetectedMatch Confidence level for Germany: Not DetectedMatch Confidence level for Luxembourg: Not DetectedMatch Confidence level for Netherlands: Not DetectedMatch Confidence level for Switzerland: Not Detected
-
Percent Scandinavian ancestry: 0.0.Match Confidence level for Denmark: Not DetectedMatch Confidence level for Faroe Islands: Not DetectedMatch Confidence level for Iceland: Not DetectedMatch Confidence level for Norway: Not DetectedMatch Confidence level for Sweden: Not Detected
-
Percent Broadly Northwestern European ancestry: 0.5.
-
Percent Ashkenazi Jewish ancestry: 0.0.
-
Percent Eastern European ancestry: 0.0.Match Confidence level for Belarus: Not DetectedMatch Confidence level for Czech Republic: Not DetectedMatch Confidence level for Estonia: Not DetectedMatch Confidence level for Hungary: Not DetectedMatch Confidence level for Latvia: Not DetectedMatch Confidence level for Lithuania: Not DetectedMatch Confidence level for Poland: Not DetectedMatch Confidence level for Russia: Not DetectedMatch Confidence level for Slovakia: Not DetectedMatch Confidence level for Slovenia: Not DetectedMatch Confidence level for Ukraine: Not Detected
-
Percent Broadly European ancestry: 2.6.
We found evidence of your ancestry in the following locations. People from these regions can often trace their ancestry to different, historically separate populations.
-
Match Confidence level for Colombia: Highly Likely MatchHighly Likely MatchMatch Confidence level for Venezuela: Highly Likely MatchHighly Likely MatchMatch Confidence level for Argentina: Not DetectedNot DetectedMatch Confidence level for Bolivia: Not DetectedNot DetectedMatch Confidence level for Brazil: Not DetectedNot DetectedMatch Confidence level for Chile: Not DetectedNot DetectedMatch Confidence level for Ecuador: Not DetectedNot DetectedMatch Confidence level for Guyana: Not DetectedNot DetectedMatch Confidence level for Paraguay: Not DetectedNot DetectedMatch Confidence level for Peru: Not DetectedNot DetectedMatch Confidence level for Uruguay: Not DetectedNot Detected
-
Match Confidence level for Cuba: Likely MatchLikely MatchMatch Confidence level for Antigua and Barbuda: Not DetectedNot DetectedMatch Confidence level for Aruba: Not DetectedNot DetectedMatch Confidence level for Bahamas: Not DetectedNot DetectedMatch Confidence level for Barbados: Not DetectedNot DetectedMatch Confidence level for Dominica: Not DetectedNot DetectedMatch Confidence level for Dominican Republic: Not DetectedNot DetectedMatch Confidence level for Grenada: Not DetectedNot DetectedMatch Confidence level for Haiti: Not DetectedNot DetectedMatch Confidence level for Jamaica: Not DetectedNot DetectedMatch Confidence level for Martinique: Not DetectedNot DetectedMatch Confidence level for Puerto Rico: Not DetectedNot DetectedMatch Confidence level for Saint Barthélemy: Not DetectedNot DetectedMatch Confidence level for Saint Lucia: Not DetectedNot DetectedMatch Confidence level for Saint Vincent and the Grenadines: Not DetectedNot DetectedMatch Confidence level for Trinidad and Tobago: Not DetectedNot Detected
-
Match Confidence level for Belize: Not DetectedNot DetectedMatch Confidence level for Costa Rica: Not DetectedNot DetectedMatch Confidence level for El Salvador: Not DetectedNot DetectedMatch Confidence level for Guatemala: Not DetectedNot DetectedMatch Confidence level for Honduras: Not DetectedNot DetectedMatch Confidence level for Mexico: Not DetectedNot DetectedMatch Confidence level for Nicaragua: Not DetectedNot DetectedMatch Confidence level for Panama: Not DetectedNot Detected
-
Southern European
1586
Gibraltarian, Portuguese, SpanishGreek & Balkan
612
Albanian, Bosnian and Herzegovinian, Bulgarian, Croatian, Greek, Kosovan, Macedonian, Maltese, Moldovan, Montenegrin, Romanian, SerbianItalian
596
Italian, northern Italian, TuscanSardinian
25
-
Northwestern European
2953
British & Irish
1011
Irish, United KingdomFinnish
363
French & German
950
Austrian, French, German, Belgian, Dutch, SwissScandinavian
629
Danish, Faroese, Icelandic, Norwegian, Swedish -
Ashkenazi Jewish
1007
-
Eastern European
782
Belarusian, Czech, Estonian, Hungarian, Latvian, Lithuanian, Polish, Russian, Slovak, Slovene, Ukrainian
Understanding Ancestry Composition
In the DNA of all of us is a story, and that story is part of the broader human story. It’s a history of people migrating out of Africa and venturing out to populate the globe and build new cultures. Over millennia, as different groups of people separated from each other to move into new frontiers, small changes in our DNA occurred, leaving behind subtle clues about our history. Your Ancestry Composition report is a window into your story, and is powered by cutting-edge algorithms and data from diverse populations around the world.
At the heart of your Ancestry Composition report is your ancestral breakdown: a list of your population percentages arranged in a hierarchy of from the continental-level to more fine-scale, regional ancestries. For example: one person's DNA results may suggest 95% European ancestry, which can be further subdivided into smaller regional populations, like 60% British & Irish, 25% French & German, and 10% Scandinavian.
You may notice another layer of insights about the likely origins of more recent ancestors; these specific recent ancestor locations are listed just beneath each regional population percentage. Following the previous example, someone predicted to have 25% “French & German” ancestry may see specific recent ancestor locations where this “French & German” ancestry is common, such as Belgium or France.
The way we determine your recent ancestor locations (i.e. Belgium) is different from the way we calculate your ancestral background (i.e. 40% French & German). Instead, we use a separate algorithm to further refine your results. By way of example, if you have 40% French & German ancestry as well as a recent ancestor location result for Belgium, this does not necessarily mean that you have 40% Belgian ancestry – as you may still have German, French, Austrian, Dutch, or Swiss ancestry included in that 40% “French & German” result. We also report our confidence with which we assigned each recent ancestor result within the Scientific Details section. You can think of the confidence indicator as the probability that you have recent ancestry from a specific location; it doesn't necessarily provide information about how much recent ancestry is from that location.
Some pieces (or segments) of your DNA may resemble those of reference populations from multiple places around the world. For example, if a segment of your DNA matches reference DNA from many different European countries but not from outside of Europe, then we label your DNA "Broadly European." If a segment of your DNA matches a wide range of the Ancestry Composition populations (or it doesn't match any of them with high confidence), then we label it "Unassigned."
Broadly assigned ancestry can tell a different story about your genetic history than narrowly assigned ancestry. Your DNA segments with broadly assigned ancestry may match reference individuals from a relatively wide range of ancestral populations – possibly reflecting widespread migrations that occurred earlier than the timeframe for our Ancestry Composition algorithm. However, broadly assigned ancestries could also be capturing unique populations for which we don’t currently have data.
Our Ancestry Composition algorithm looks at short pieces of your DNA one by one. For each piece, it calculates the probability that the piece belongs to each of the different Ancestry Composition populations. When that probability is high for a single ancestry (or for one of the "Broadly" ancestry categories), we "assign" that ancestry to that piece of DNA. If none of the populations tested have a high probability (which can happen when an ancestry is not well described by our reference datasets), then that piece of DNA has Unassigned ancestry.
We are constantly working to improve our algorithm and collect more reference data. As the science continues to get better, we will be able to report on and distinguish more and more ancestry populations. Learn more about how we calculate your broadly and unassigned ancestries in our Ancestry Composition Guide.
Small amounts of ancestry can mean different things for different people, and you may have to do some digging to learn what your trace ancestries (1% or less) mean for you.
We report Ancestry Composition results as small as 0.1% because our algorithm does a very good job estimating ancestry for each small piece of the genome. We believe that sharing your exact results allows you to get the most information — even though sometimes interpretation of those results isn't easy.
You can learn more by looking at your Chromosome Painting. Your 0.1% ancestry is more likely to reflect a real genetic history (and less likely to reflect random chance) if it is still assigned at the higher confidence levels. Another way to gain confidence in your ancestry estimate is to connect with close relatives and see whether their results also include small amounts of the same ancestry.
How long ago did I have an ancestor from this population?
There is randomness involved in how much DNA you receive from each of your ancestors, especially your ancestors from many generations back, so it's impossible to pinpoint this exactly.
Check out your Ancestry Timeline result for an estimate of when your most recent ancestor from each Ancestry Composition population lived, based on your genetics.
The technical details: chromosome recombination
Between every generation, our chromosomes recombine, meaning pieces of the chromosomes we inherited from mom swap places with pieces of the chromosomes we inherited from dad, and these new, mixed chromosomes are what we pass on to our children.
You will only pass on 50% of your DNA to each of your children, and – on average – 25% to each of your grandchildren. Continuing this pattern, by the time you are four generations removed (i.e. from a great-great-grandchild), you will only have passed on around 6.25% of your DNA. Similarly, by the time you are ten generations removed (i.e. from an 8th-great-grandchild), you will – on average – have passed on just 0.1% of your DNA. This percentage – 0.1% of your DNA – approaches the limits of the resolution of the Ancestry Composition algorithm, meaning we cannot easily distinguish smaller segments of your DNA. Also, while you may have DNA that you inherited from a distant ancestor, this inheritance becomes very "stochastic" around approximately seven to ten generations, meaning the presence or absence of DNA segments inherited from a distant ancestor is largely dependent on random chance.
Your Ancestry Composition results are comprised of what are frequently considered to reflect “Old World” populations — distinct populations that existed prior to widespread international travel (approximately 500 years ago). However, some countries have populations that are highly admixed (“admixture” refers to places where there was mixing of previously separate populations). For example, most Puerto Ricans today have a combination of Indigenous American, European, and West African ancestry.
If we found evidence of your ancestry in one or more of these admixed regions, then you likely had an ancestor from that region within the last few hundred years. Your Ancestry Composition percentages might not give you the whole picture, so we hope these results provide additional historical context about your more recent ancestral locations.
We calculate your ancestor locations within these admixed regions the same way we calculate your recent ancestor locations for other populations included in your Ancestry Composition report. If you want to learn more about how we determine your recent ancestor locations, read the FAQ, “What do the different confidence levels mean?” under the section called “Getting more out of Ancestry Composition.”
There are many ways to understand how your DNA connects you to the admixed regions included in your Ancestry Composition report.
For example:
- A customer with 85% West African ancestry may also have genetic evidence of recent ancestry in Haiti which is over 3,500 miles away from the closest point in West Africa. However, it is very common for Haitians to have a mixture of more specific West African ancestries (such as Nigerian, Senegambian & Guinean & Congolese), as well as some European ancestry. As a result, Haiti is grouped with other places of admixed ancestry in the Caribbean.
What are the admixed regions and what countries are included in these regions?
Mexico & Central America
Belize, Costa Rica, El Salvador, Honduras, Guatemala, Mexico, Nicaragua, Panama
South America
Argentina, Bolivia, Brazil, Chile, Colombia, Ecuador, Guyana, Paraguay, Peru, Uruguay, Venezuela
Caribbean
Antigua and Barbuda, Aruba, Bahamas, Barbados, Cuba, Dominica, Dominican Republic, Grenada, Haiti, Jamaica, Martinique, Puerto Rico, St. Lucia, St. Vincent and the Grenadines, Trinidad and Tobago
Your Chromosome Painting is a visual depiction of the 23 pairs of chromosomes that make up your genome. Each chromosome is one long string of DNA — if you think of your genome as a book, the chromosomes are like the chapters.
You can see from the Chromosome Painting that your chromosomes come in pairs. Each pair of chromosomes is represented as a pair of colorful horizontal bars, labeled with numbers (1 through 22) or letters (X or Y) and colored by ancestry.
You inherited one of each pair of chromosomes from your mother, and the other from your father. Unless at least one of your parents is also a 23andMe customer, we can't tell which chromosomes you inherited from which parent. But if you connect with one or both of your parents, then your Chromosome Painting will update so that the top chromosome in each pair is the one you inherited from your mother, and the bottom chromosome is the one you inherited from your father.
Your Chromosome Painting contains a huge amount of information to explore. Take a look at this list of suggestions to get you started, or check out the blog post for even more information.
- The Chromosome Painting uses colors to show which pieces of your genome came from which of the 31 Ancestry Composition populations. You can hover your mouse over the different populations to highlight where they are found in your DNA.
- Talk with relatives or connect with them on 23andMe to compare which ancestries you have in common. If your parents are 23andMe customers, you can connect with them to learn which chromosomes you inherited from which parent. See the Frequently Asked Question, How can I learn more about my ancestry by connecting with family members? to learn more.
- The color of the DNA segments in your Chromosome Painting tells you about your Ancestry Composition, but the number and size of those segments is meaningful too. The shorter a segment is, and the fewer segments you have from one ancestry, the more generations since your most recent ancestor from that population.
- Change the confidence levels to see how they impact your Ancestry Composition. See the Frequently Asked Question, What do the different confidence thresholds mean? to learn more.
Unexpected results
We have a high confidence in the accuracy of your results and the science behind them. But 23andMe is a genetic testing service, which means we can only show you what is found in your DNA. We recommend that you use your genetic reports together with your family history to build a complete understanding of your ancestry.
Why don’t I see an expected regional population percentage or recent ancestor location?
There are a few common reasons why your results might not match what you expect based on historical records or family stories:
- Some genetic populations are especially difficult to tell apart because they share common history. If you have genetic ancestry from one of these populations, it may be assigned to a broader category. For example, Italian ancestry may be classified as a combination of Italian and Broadly Southern European.
- Ancestry Composition populations are defined by genetically similar groups of people, not by the political borders of countries. In some cases, your ancestry may highlight the differences between population history and political history. For example, if you have ancestry from a part of France that is very close to the border with Spain, your DNA may be classified as Iberian (the population that includes Spanish ancestry) instead of French & German. In addition, if you are from a group within a country that is not common in our reference dataset or is very genetically similar to other countries for which we have larger sample sizes, it is less likely that you will get a match for that recent ancestor location.
- The time scale reflected by Ancestry Composition may be different from the time scale of your records. The reference datasets that we use to calculate your Ancestry Composition are designed to reflect distinct, genetically similar populations that existed before transcontinental travel and migration was common (~500 years ago). For example, if recent generations of your family lived in Latin America, you are likely to have some Native American and some Iberian genetic ancestry because most mixing between those two populations happened within the past 500 years.
- Countries are not all genetically distinct groups. For example, if you are from a group within a country that is not common in our reference dataset or is very genetically similar to other countries for which we have larger sample sizes, it is less likely that you will get a match for that recent ancestor location.
- Country borders have changed a lot even within the past 100 years, which can sometimes produce confusing recent ancestor location results. For example, country borders in Eastern Europe and the Balkans changed dramatically with the dissolution of the Soviet Union in the last decade of the 20th century.
Your results will include Native American ancestry if a piece of your DNA resembles our Native American reference panel. If your results do not include Native American ancestry, that does not necessarily mean that your understanding of your family heritage is incorrect.
Here are a few common reasons why you may not see the Native American ancestry in your results:
- If your most recent Native American ancestor was more than five generations ago, you may have inherited little or no DNA directly from them. The farther back in your history you look, the less likely you are to have inherited DNA directly from every single one of your ancestors. This means that you can be directly descended from a Native American without having any Native American DNA.
- Your Native American ancestry may be assigned to a “Broadly” category. Even using state-of-the-art science, the Native American and Northeast Asian populations are genetically similar, and sometimes they can't be distinguished from each other with high confidence.
- Throughout American history, people without a genetically Native American background have claimed Native American heritage for a variety of social reasons related to the shifting politics of race and indigeneity in the United States. As a result, many families without any genetically Native American ancestors have passed down stories about Native American ancestry. For examples, see this article or the book, Becoming Indian: The Struggle over Cherokee Identity in the Twenty-first Century, by Circe Strum.
While we are very confident in the way we calculate your results, we cannot make statements about the quality of your results from a different company. But if your results from 23andMe don't match the results you got from a different test, that could reflect differences in how we calculate your genetic ancestry.
Genetic ancestry calculations can disagree with each other for a few different reasons:
- Different companies rely on different reference datasets. The 23andMe reference datasets are made up of thousands of people with known ancestry, many of whom are 23andMe customers, and we use them to define our Ancestry Composition populations.
- As people migrate, the genetic patterns associated with a specific place can change over time. The 23andMe reference datasets were designed to reflect distinct global populations that existed before the widespread international travel and migration of the last 500 years.
- There are different ways to calculate your ancestry from your DNA. 23andMe uses an approach that involves phasing, which means we calculate your mom's and your dad's contribution to your ancestry separately.
- At 23andMe, we calculate your ancestry separately for small pieces of your genome one by one, using advanced machine-learning techniques. This piece-by-piece calculation creates powerfully informative results, including your Chromosome Painting and your Ancestry Timeline from each ancestry population, which contain a wealth of information to help you explore how you inherited your ancestry from your genealogical ancestors.
23andMe has offered customers a breakdown of their ancestry since 2008. A lot has happened since then – millions of individuals have joined our "gene pool" and ongoing research efforts have helped us understand more about genetic diversity around the world. We've also made great strides in improving the underlying algorithms that we use to deliver these results. In 2008, we broke down ancestry into three main categories: African, European, and East Asian. Since then we've offered a series of updates where we refined those original estimates into more and more granular results.
When we update the reference populations or the algorithms used to predict your ancestry, your results are expected to change. We have thus become accustomed to calling Ancestry Composition a living analysis of your DNA. For the most part, these changes should be minor and hopefully provide you with more detail about your ancestral origins. Sometimes these changes affect your regional population percentages, and sometimes they affect recent ancestor locations (the countries and territories sometimes listed beneath your percentages). Each time we make an update we update the "Change Log", which can be found at the bottom of the Scientific Details page.
Note that there are other reasons why your results can change. If you connect with one or both parents, we are able to further refine your results. See How can I learn more about my ancestry by connecting with family members?
Why did my recent ancestor locations change?
The reference populations we use to calculate your recent ancestor locations (the countries or territories listed underneath your regional population percentages) are updated on a frequent basis to include new reference individuals, so you may see your recent ancestor locations change as the size of our database grows. We are also constantly working to improve this calculation in a way that is more precisely calibrated to each location.
Want even more detail about how we estimate your ancestry? Check out our Ancestry Composition Guide.
Even though you have the same parents, you and your sibling only share about half of your DNA. Your Ancestry Composition may be different in the half of your genome that you don't share.
Why does it work that way? For simplicity, let's focus on your mother. You inherited half of your mother's DNA, and your sibling also inherited half of your mother's DNA. But which half you inherited is the result of random chance because of a process called recombination. Through your mother, maybe you inherited a little more of your DNA from your maternal grandmother, and a little less from your maternal grandfather. Maybe for your sibling, it was the other way around. If your maternal grandmother and grandfather had different genetic ancestries, then your Ancestry Composition would be closer to your grandmother's, and your sibling's Ancestry Composition would look more like your grandfather's.
The science behind Ancestry Composition
We determine your Ancestry Composition using only the information in your DNA and the DNA of other people with known genetic ancestries (our reference datasets). Your 23andMe reports are always based on your genetics. If your results describe you perfectly, that just goes to show you how much your DNA really tells about you!
The technical details: regional population percentages
The 23andMe Ancestry Composition algorithm looks at short, non-overlapping pieces of your DNA, one by one. We compare each piece of your DNA to reference DNA from populations around the world. When a piece of your DNA matches the reference DNA from a specific ancestry population with a high degree of confidence, your DNA is assigned to that population. The results of these assignments are added up across your genome to calculate your overall Ancestry Composition.
Want to learn more about the science behind 23andMe Ancestry Composition? Check out our Ancestry Composition Guide.
The technical details: recent ancestor locations
Recent ancestor locations – like Belgium, Brazil, or Bangladesh – relate to the amount of DNA you share with people who have roots in that location (these people are called “reference individuals”). So, the more DNA you share with reference individuals from specific locations, the higher the likelihood is that those locations will be assigned to you. On average, people from a smaller, more homogenous country like Iceland will share more DNA than people who come from a larger, more diverse country like China. Because of population differences like these, we add a calibration step when determining our confidence for each recent ancestor location assignment.
Why do we ask you questions about your ancestry?
We never use your survey answers to produce your ancestry results. So why do we ask questions about your ancestry? Because you can tell us more about yourself than we can learn just by looking at your DNA alone. We use your self-reported ancestry for the following purposes:
- For customers who receive Health reports, we ask questions about ancestry and ethnicity to personalize results as much as possible. We use your self-reported ethnicity to calculate your post-test risk in Carrier Status reports and to show a “typical” result for comparison in your Traits reports.
- 23andMe customers also have the opportunity to participate in ancestry surveys. We use the results of these surveys to improve ancestry features that 23andMe customers know and love.
- We also use survey results from customers who have consented to research to advance genetic science through research studies. For example, check out this 23andMe publication about 23andMe research participants in the US who self-identify as African American, Latino, and European.
Ancestry Composition is designed to distinguish between as many populations as possible, but we only include specific ancestries if we can distinguish between them with high accuracy. Some genetic ancestries are inherently difficult to tell apart because the people in those regions mixed throughout history or have shared history. As we continue to collect more reference data and refine our algorithms, we will update Ancestry Composition to include new populations.
In addition, the reference populations we use to calculate your recent ancestor locations are updated on a regular basis to include new individuals, so you may see new recent ancestor locations as the size of our database increases.
Genotyping chips
We determined your Ancestry Composition results based on genetic information that originated from a genotyping chip. Over the past decade, the quality of these chips has improved as new versions were released. Ancestry Composition is finely tuned to specific genotyping chip versions and sometimes new updates results are released on the newest version first before older versions.
In some cases, we don’t have enough data to tell different populations apart. As we collect more reference data, more specific ancestries will become easier to distinguish, and we will be able to report on more Ancestry Composition populations.
Confronting bias
Because the majority of 23andMe customers are US residents with European ancestry, we have a lot of reference data from European populations, and we are able to distinguish more sub-populations from Europe as in any other continent. The 23andMe Research team is constantly working to get new data from diverse populations and to maximize the number of ancestries we can distinguish.
Historically, biomedical research has disproportionately included participants of European descent. Our mission at 23andMe is to help people access, understand, and benefit from the human genome. The best way we can do that for underserved populations is to include their genetic data in our research and our features. As we gain more diverse 23andMe customers through initiatives like the African Genetics Project, their genetic information will help to improve features like Ancestry Composition.
Your Ancestry Timeline shows an estimate of when your most recent ancestor from each Ancestry Composition population lived. We use several pieces of information to calculate your Ancestry Timeline, including the number of DNA segments you have from each ancestry, the length of those segments, and the number of chromosomes they are found on. If your most recent ancestor from a population was very recent, you will have more segments of that ancestry on more chromosomes, and those segments will be longer, than if your most recent ancestor was many generations ago.
What is recombination?
Every time DNA is passed from one generation to another, the two chromosomes in each pair are randomly shuffled with each other in a process called recombination. This process can break up long segments of a single ancestry into shorter segments. Sometimes very short segments of ancestry are lost during recombination and don’t get passed to the next generation. This is why ancestry from your distant ancestors only shows up in a few short segments, if at all.
Why do I have a population in my Ancestry Composition that is not in my Ancestry Timeline?
Your Ancestry Timeline only shows narrow ancestries, which are not broken down into more specific ancestries. The broad, regional and continent-level ancestry populations and Broadly Assigned ancestries are not included in your Ancestry Timeline.
Additionally, your Ancestry Timeline is calculated using the ancestry segments on your 22 autosomal chromosomes. Ancestry populations that are only found on your X chromosome are not included in your Ancestry Timeline. This is because the X chromosome has a more complicated process of inheritance and recombination than the autosomal chromosomes, so it can't be analyzed in the same way. To see which segments of your ancestry are found on which of your chromosomes, check out your Chromosome Painting.
Getting more out of Ancestry Composition
If you have a biological parent who is also a 23andMe customer, you can improve your Ancestry Composition report by connecting with them through the Share and Compare tool. For more information about connecting, see the How sharing works information page.
If you and your parent or child have profiles under the same 23andMe account, then your profiles will be connected automatically, and you won’t have to connect manually through Share and Compare.
How will my Ancestry Composition change if I connect with a parent?
When you connect with a biological parent through the Share and Compare tool, your Ancestry Composition will receive the following updates:
- We will use the additional information we learn from your parents' DNA to improve the resolution of your Ancestry Composition, so you may see slight changes in your Ancestry Composition results.
- If you connect with one or both of your parents, Ancestry Composition determines which parts of your DNA you inherited from each parent. Your Chromosome Painting will update so that the top chromosome in each pair is the one you inherited from your mother, and the bottom chromosome is the one you inherited from your father.
- If you connect with one or both of your parents, the Parental Inheritance section in your Ancestry Composition report will become active. You will be able to see the proportions of each ancestry that you inherited from each parent.
- Note: Connecting with a child does not change the Ancestry Composition results for parents.
To learn more about how your Ancestry Composition changes when you connect with a parent, read our article on The Phasing Process.
For more information about the algorithm powering the Ancestry Composition report and why connecting with close family members improves the resolution of your Ancestry Composition result, check out the Ancestry Composition Guide.
Our algorithms make ancestry estimates based on probabilities and they’re generally very accurate, but your results are not set in stone. We are always trying to improve and refine these estimates. Therefore, we’ve included ways for you to explore your results at different levels of scientific certainty (i.e. “confidence”), and get more from them.
The algorithm we use to calculate your ancestral breakdown analyzes one small piece of your DNA at a time. For each piece of your DNA, we calculate the probability of that piece matching each reference population. By default, your results are calculated at a 50% confidence level; you can explore your results at different confidence levels by clicking the “Change confidence level” link in the Chromosome Painting section of the report.
Similarly, the algorithm we use to calculate your recent ancestor locations looks for pieces of DNA you share with individuals from around the world. Based on how much DNA you share and which country or territory is being considered, we assign a confidence to our prediction. We report these confidence levels in the Scientific Details section as “not detected,” “possible,” “likely,” or “highly likely.” “Possible” means we are between 30% - 49.9% confident in the assignment, while “highly likely” means we are at least 80% confident in the assignment. “Not detected” means we are less than 30% confident in assigning that recent ancestor location to you.
Chromosome Painting
Let’s consider an example: Suppose there is a piece of DNA that is found in both Balkan and Italian populations, but it’s more common in Italy. If you have this piece of DNA, our algorithm might estimate that it has a 75% chance of reflecting Italian ancestry and a 20% chance of reflecting Balkan ancestry. If you set the confidence slider to 70%, then that piece of DNA will be labeled as Italian, because our 75% Italian estimate is greater than the 70% confidence threshold.
But if you set the confidence slider to 80%, the piece of DNA won’t be labeled as Italian because 80% is higher than the 75% Italian estimate. Instead, that piece of DNA will be labeled as Broadly Southern European, as there is a 75% chance of being Italian plus a 20% chance of being Balkan, which equals 95% chance of being Broadly Southern European. This example also shows why you are likely to see more "Broadly" or "Unassigned" ancestry in the Conservative View than in the Speculative View.
Does this mean you’re not confident in my Ancestry Composition if I set the slider to "Speculative"?
The short answer is no. We are confident in all of the results we provide, and we include the confidence slider to give you as much information about your ancestry as possible. The different views can be helpful in different ways, depending on what kind of information you’re looking for. You may also learn from how the painting changes when you change the slider.
The long answer is more complicated. We strive to push the cutting edge of genetic science so that we can share as much information with you as possible. And at the cutting edge of any scientific field, it’s usually impossible to say anything with 100% certainty. Instead, scientists talk about probabilities and uncertainty. It is impossible to paint your chromosomes with 100% certainty, but we give you the opportunity to explore how your Ancestry Composition looks across the range from 50% certainty to 90% certainty.
Recent Ancestor Locations
In order to be assigned a recent ancestor location, you must share identical DNA segments with people of known ancestry from that location. Importantly, we don’t include close relatives (i.e. first cousins or closer) in this calculation, and these matching DNA segments must be unique, meaning we do not double-count identical segments you might share with multiple distant relatives. These initial steps determine the percent genome shared between you and the reference individuals for each location.
Next, we do a calibration step to set more meaningful thresholds that accounts for the special demographic histories of each location. This calibration step helps determine whether you share a similar genetic makeup to people who have recent ancestry from a specific location. We then use this comparison to set unique confidence thresholds for each location.
Understanding my ancestry detail reports
The maps in your Ancestry Detail reports relate to your recent ancestor locations — countries and territories that may appear in your results if you share a significant amount of identical DNA with the 150+ reference populations that 23andMe has assembled. The shaded regions of each map show specific regions within each country or territory where we have found evidence of your family’s recent ancestry. The stronger the evidence of ancestry, the darker the shading is for that region.
It's important to note that you'll only see a map in an Ancestry Detail report if you have a corresponding recent ancestor location within the Ancestry Composition report, with a match confidence of at least “possible match.” For example, you'll only see an Ancestry Detail map for Switzerland on the French & German Ancestry Detail report if Switzerland appears within your Ancestry Composition report. Read more about how your recent ancestor locations are calculated.
While your Ancestry Detail maps may bring your ancestry into clearer focus, they might also bring up more questions. There are several reasons why you might see unexpected regional shading:
- You may not have enough relatives with self-reported ancestry from a particular region. The historical migration patterns of your DNA relatives and their ancestors might impact the map of your regional origins.
- Urban centers might disproportionately appear darker. Urbanization and human migration patterns may have caused some urban centers on your map to appear more darkly shaded than other regions. It’s statistically likely that many of your distant relatives are from dense urban centers, resulting in darker shading around cities and lighter shading around other known places of ancestry.
- Regional borders may have shifted in the last 200 years. Just like country borders, it’s possible that regional borders have shifted, possibly contributing to unexpected results.
We are constantly working to expand and diversify our datasets. Expect to see your results change and improve over time.